


Introduction
CT is widely regarded as the imaging modality of choice for the evaluation of patients with known or suspected small-bowel disease [1, 2]. Yet, despite the known utility of CT in assessing patients with inflammatory bowel disease (IBD), radiation exposure remains a major concern in this particular population as patients with IBD are more likely to be younger and to be imaged multiple times leading to increased cumulative radiation exposure over their lifetimes [3]. Among the several dose reduction approaches used in CT, reduction of the tube voltage from conventional 120 kVp to 80 kVp has been highlighted as it can potentially reduce organ dosage by up to 65% while providing the added advantage of increased iodine attenuation by a factor of 1.7 as the k-edge of iodine is closer to the reduced tube voltage [4, 5]. However, a main limitation of low tube voltage CT for abdominal applications is the concern of image quality loss owing to increased image noise and higher susceptibility to beam-hardening artifacts [6].
Recently, the development of newer image reconstruction algorithms has demonstrated the potential to overcome the increased noise that comes with low tube voltage CT techniques by generating images with less noise than those reconstructed with the standard filtered back projection (FBP) algorithm [7-14]. Among them, adaptive statistical iterative reconstruction (ASIR) is an algorithm which repeats successive iterative transformations of the measured value of each pixel to a new estimated pixel value while comparing it to the ideal value that the noise model predicts until the final estimated and ideal pixel values converge [8-11]. A more recent model-based iterative reconstruction (MBIR) product in the market, Veo, uses real 3-dimensional system optics instead of idealized system optics, directly weighing each measured projection point, thereby leading to improved overall image quality while reducing more noise than ASIR [9-11].
There has been one previous report showing the effectiveness of 80 kVp CT using these IR algorithms for small bowel diseases, however, the study was retrospectively designed and compared 80 kVp CT with 120 kVp CT in different patient groups [8]. In addition, although both 80 kVp CT and 120 kVp CT were imaged in the same patient in some cases, there was a time gap between the two images in which disease activity may have been significantly different between the two CT datasets, making a direct side-by-side comparison between conventional 120 kVp and 80 kVp CT images impossible [8].
Therefore, the purpose of our study is to evaluate the feasibility of ultra-low dose 80 kVp CT for the evaluation of IBD in a rabbit model and to investigate the effect of two different IR algorithms at 80 kVp CT on image quality and diagnostic performance in comparison to same session conventional 120 kVp images.
Materials and Methods
This study was carried out in strict accordance with the recommendations in the Guide for the Care and Use of Laboratory Animals of. The protocol was approved by the Animal Care and Use Committee of Seoul National University Hospital (Permit Number: 14-0154-S1A2). The institutional review board waived the need to obtain informed consent because this study was an animal study.
Animals
Twenty-eight male New Zealand white rabbits weighing 2.5-3.0 kg were randomly divided into two groups: 18 in the IBD group and 10 in the control group. Prior to the procedures, the rabbits were anesthetized with an intramuscular injection of a mixture of zolazepam (5 mg/kg, Zoletil®; Virbac, Carros Cedex, France) and xylazine (10 mg/kg, Rompun®; Bayer-Schering Pharma, Berlin, Germany).
Rabbit Model of Inflammatory Bowel Disease
After the rabbit was anesthetized, an enema was done with 100 ml of saline to remove the feces in the rectosigmoid colon. After the enema, a Foley catheter (12 Fr, Yushin medical, Korea) was inserted via the anus placing the tip at the iliac artery bifurcation level under the guidance of ultrasonography (Accuvix XQ, Samsung Medison, Korea) using a 5-12 MHx linear probe. Ballooning was done with 2 mL of normal saline not to spill out the solution. To induce colitis, 3 mL of 5% weight/volume 2, 4, 6 tri-nitrobenzene sulfonic acid (TNBSA) solved in methanol (Pierce Biotechnology, IL, USA) was administrated via the Foley catheter. To ensure the distribution of the TNBSA solution in the sigmoid colon, all rabbits were carefully maintained at a 30° head down position for 10 minutes and then returned to their cages.
CT Acquisition
All 28 CT examinations were performed on a 64-row MDCT scanner (Discovery CT750 HD, GE Healthcare, USA). Neutral oral or rectal contrast material was not used in any of the animals. All rabbits received 6 mL of nonionic iodinated contrast material with an iodine concentration of 350 mg/mL (iohexol; Iobrix 350, TaeJoon Pharm, Korea) followed by a 5 mL saline flush at a rate of 1.2 mL/s injected with a mechanical power injector. Each rabbit was scanned at 80 kVp first, followed by 120 kVp, after a default delay. The first 80 kVp scanning was initiated in the portal venous phase 40 seconds after the administration of the contrast bolus and ranged from the dome of the diaphragm to the perineum. In all 80 and 120 kVp examinations, the following imaging parameters were utilized: scan type, helical; gantry rotation time, 0.5 seconds; detector configuration, 0.625 mm × 64; pitch, 0.984; and speed, 79 mm/s. The tube currents utilized were 10 mA (5 mAs) and 20 mA (10 mAs) at 80kVp and 120 kVp, respectively. The FBP algorithm was used for image reconstruction of all 80 kVp and 120 kVp examinations and 50% ASIR and MBIR were additionally used for image reconstruction of 80 kVp examinations. Thus, four CT datasets (80 kVp FBP, 80 kVp 50% ASIR, 80 kVp MBIR, 120 kVp FBP) for each of the 28 rabbits yielded a total of 112 image sets. All images were reconstructed with axial 1.25 mm slice thickness at 1.25 mm intervals.
Effective Dose Estimation
Scanner-generated volume CT dose index (CTDIvol) and dose length product (DLP) were recorded for each examination. Effective dose (ED) for the examination was calculated by multiplying the DLP by a factor of 0.015, which is the dose conversion factor for CT of the abdomen and pelvis according to the guidelines provided in Publication 60 of the International Commission on Radiological Protection [15].
Quantitative Image Analysis
Quantitative analysis was performed on picture archiving and communication system (PACS) workstations (PacsViewer, Infinitt, Seoul, Korea) using high-resolution monitors (2048x2560, Barco, Belgium). An abdominal radiologist with 11 years of experience (C.I.S.) measured image noise by recording the standard deviation (SD) of attenuation in Hounsfield units within a 0.3-cm2 region of interest (ROI) placed in both the paraspinal muscles and in retroperitoneal fat at the level of the second lumbar vertebral body. All of the ROIs were placed in the same location for each of the reconstructed datasets using the copy and paste function of the PACS software. The average SD of the three measurements was recorded as the image noise.
Qualitative Image Analysis
Two board-certified abdominal radiologists (S.H.K. and C.I.S. with 18 and 11 years of experience, respectively), blinded to the scan technique, independently reviewed the axial CT images on a workstation in random order. In their review, four characteristics of each examination as described below were evaluated according to a previously described method on a 5-point scale, with 1 being the lowest and 5 the best (1 = poor, 2 = acceptable, 3 = good, 4 = very good, 5 = excellent): The first characteristic was the adequacy of the examination for bowel imaging, in which the reviewers evaluated their ability to identify fold patterns in a distended loop bowel and to differentiate normal from abnormal bowel loops in patients with suspected bowel disease. The second characteristic was the visibility of mesenteric vessels, in which the reviewers evaluated their ability to identify vessels in the adjacent mesentery within 1 cm of the bowel wall. The third characteristic was the evaluation of the liver, in which the reviewers assessed whether there was preservation of a sharp outline of the liver and portal venous branches and assessed the level of parenchymal noise. Finally, the fourth characteristic was the overall quality of the study, in which reviewers assessed whether the examination was adequate for interpretation and whether there was image noise that might obscure pathologic findings.
Evaluation for Diagnostic Performance
To evaluate the diagnostic performance of the 80 kVp CT technique in comparison with the 120 kVp, two different abdominal radiologists (M.H.Y. and I.J. with 8 years of experience) evaluated all 112 CT examinations in random order in a separate reading session. They were blinded to the final diagnosis for the presence or absence of IBD and to which segments of the bowel were involved in cases of disease. The presence or absence of IBD was recorded on a 5-point scale: 1, definitely normal; 2, probably normal; 3, possibly IBD; 4, probably IBD; 5, definitely IBD. Animals with recorded grades of 3-5 were grouped as having IBD while those with grades of 1 and 2 were considered to be normal and without bowel disease.
Statistical Analysis
All statistical analyses were performed using SPSS statistical software version 21.0 (IBM, Armonk, NY, USA) and Graphad Prism version 6 (GraphPad Software, La Jolla, CA, USA). The paired t test was used to assess statistically significant differences in CTDIvol, DLP, and ED between the 80 kVp and 120 kVp settings. Image noise and subjective scores of image quality parameters of the four image datasets were compared using repeated measure analysis of variance. A p value of < 0.05 was considered to indicate a statistically significant difference. For evaluation of the diagnostic performance in differentiating a normal bowel from IBD, sensitivity, specificity, and areas under the curve (AUCs) of the image datasets were calculated and compared using the McNemar test and receiver operating characteristics (ROC) analysis.
Results
Radiation Dose
The paired t test revealed that mean CTDIvol, DLP, and ED at the 80 kVp setting (0.13 mGy, 3.30 mGy-cm, 0.050 mSv) were significantly lower than those at the 120 kVp setting (0.77 mGy, 19.02 mGy-cm, 0.285 mSv) (P < 0.0001) (Table 1), resulting in a dose reduction of 82.5% at 80 kVp compared to the 120 kVp setting.
Quantitative Image Analysis: Image Noise
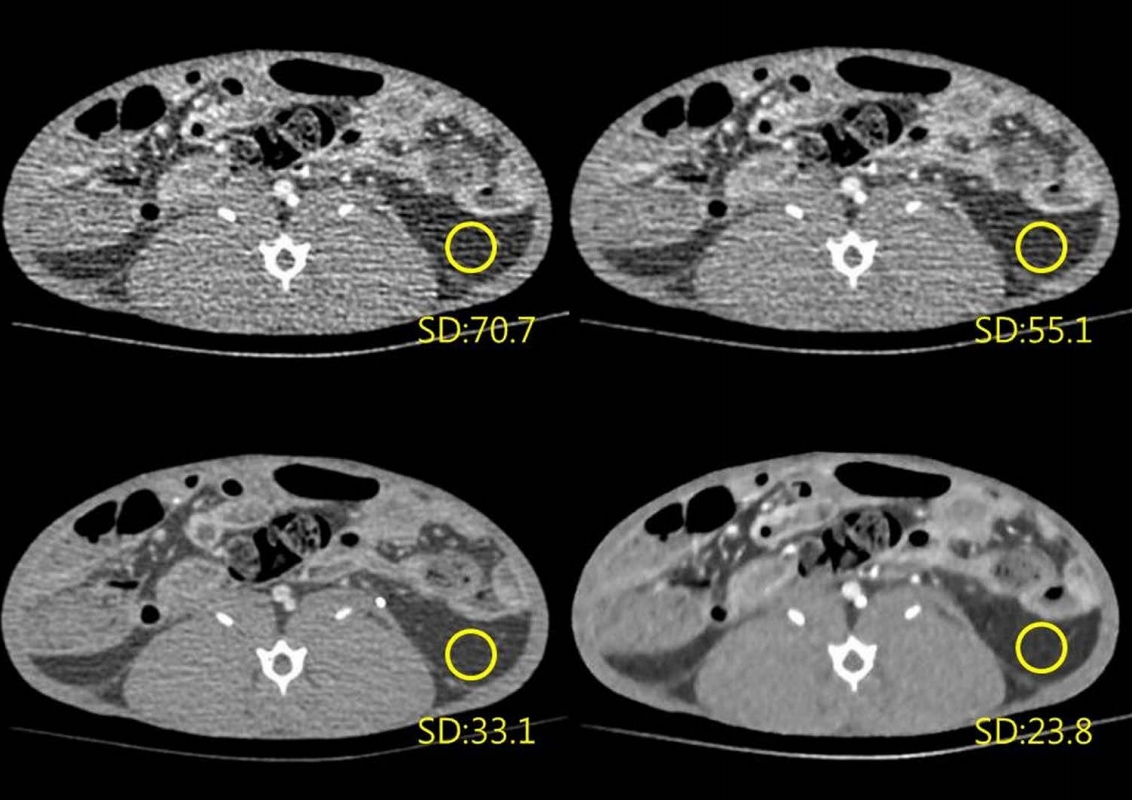
The results of quantitative analysis are summarized in Table 2. Among the four settings, mean image noise was highest at 80 kVp with FBP reconstruction, followed by 80 kVp ASIR, 120 kVp FBP, and 80 kVp MBIR in descending order (mean ± standard deviation; 60.36 ± 8.01, 47.02 ± 6.33, 23.48 ± 1.92, and 12.92 ± 1.25, respectively). With FBP reconstruction, the mean image noise of the 80 kVp setting was significantly higher than that of the 120 kVp setting (60.36 vs. 12.92; P < 0.0001). In the 80 kVp setting, image noise was significantly reduced by 22.1% (13.34/60.36) and 78.6% (47.44/60.36) with ASIR and MBIR reconstruction, respectively (P < 0.0001), compared to that using standard FBP reconstruction. Representative images are presented in Figure 1.
Qualitative Image Analysis
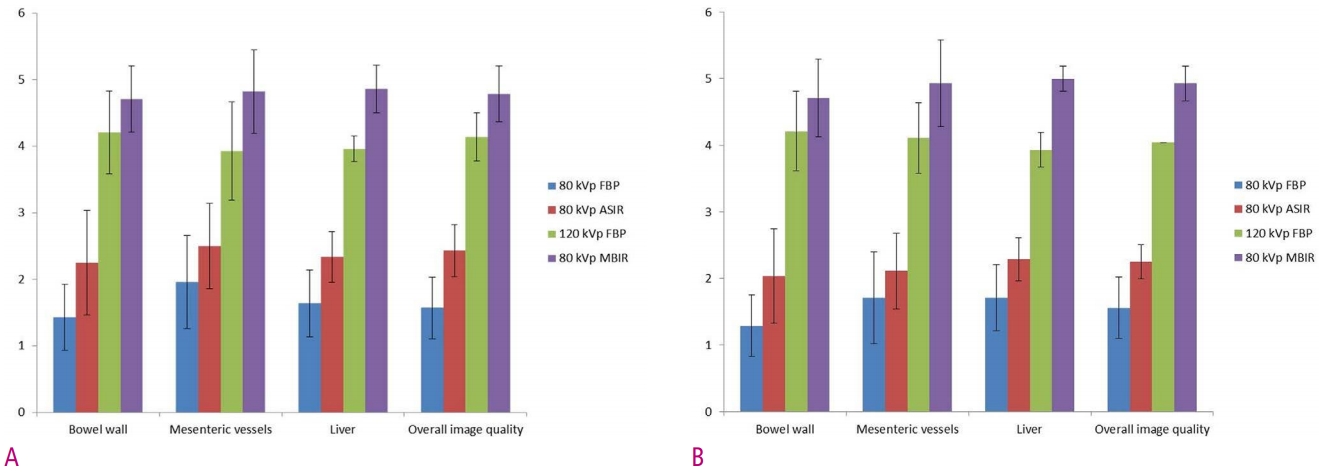
In terms of image quality, both reviewers recorded their highest scores at 80 kVp MBIR, followed by 120 kVp FBP, 80 kVp ASIR and 80 kVp FBP for all four characteristics (Table 2 and Fig. 2). There were significant differences in image quality scores among the four datasets in terms of the four characteristics (P < 0.0001). On post-hoc analysis, all comparisons of the image quality characteristics among the four datasets also showed statistical differences with P values < 0.0001 except for the comparisons between 120 kVp FBP and 80 kVp MBIR for bowel wall evaluation by both reviewers (P = 0.019 for reviewer 1, P = 0.028 for reviewer 2) and between 80 kVp FBP and 80 kVp ASIR for mesenteric vessel evaluation by reviewer 2 (P = 0.002).
Diagnostic Performance
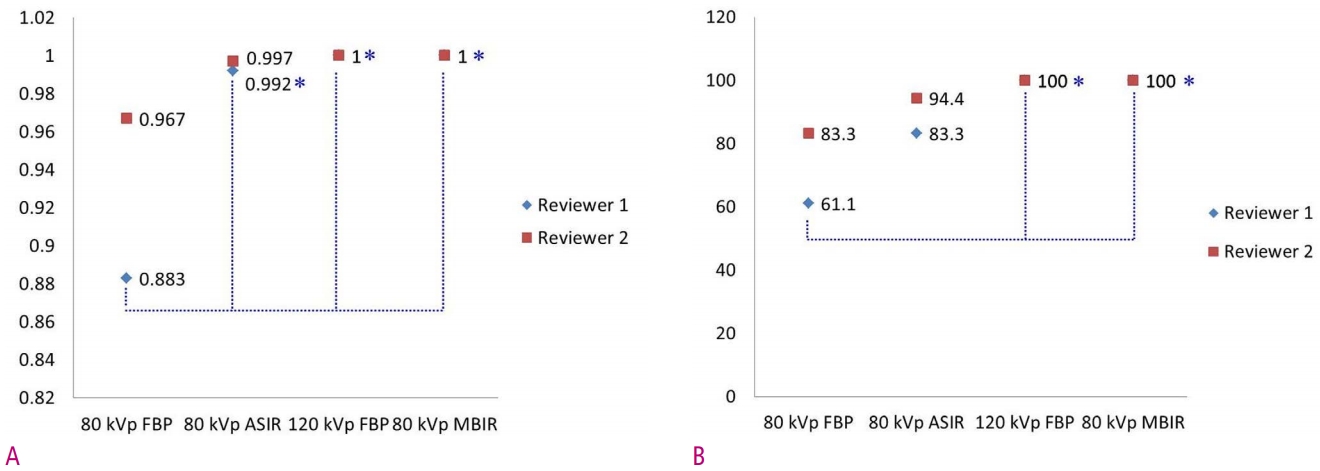
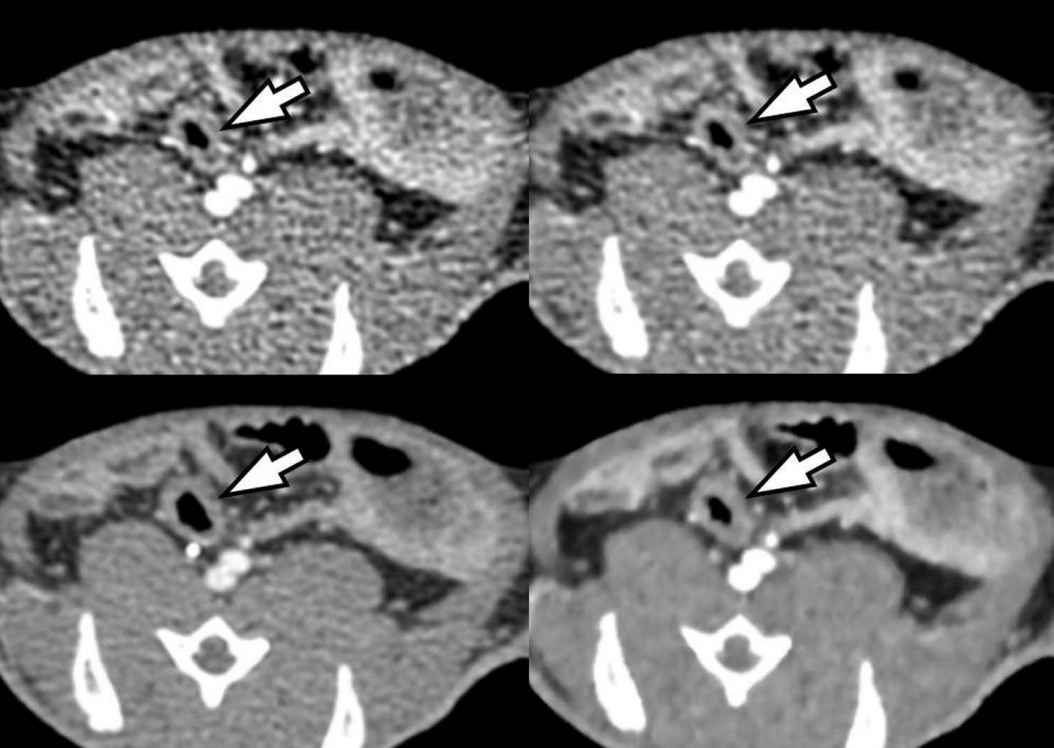
Table 3 and Figure 3 demonstrate the individual performances of the two radiologists for the differentiation between normal bowels and IBD. Areas under the curve were highest at 120 kVp FBP (1 for both reviewers) and 80 kVp MBIR settings (1 for both reviewers), followed by 80 kVp ASIR (0.992 and 0.997 for readers 1 and 2, respectively) and the 80 kVp FBP settings (0.883 and 0.967). The difference between 80 kVp FBP and the other three settings was statistically significant for reviewer 1 (P = 0.0143 ~ 0.0163). Sensitivity for differentiation was also highest at 120 kVp FBP (100% for both reviewers) and 80 kVp MBIR settings (100% for both reviewers), followed by 80 kVp ASIR (83.3% and 94.4%) and 80 kVp FBP settings (61.1% and 83.3%). The difference was statistically significant between 80 kVp FBP and 120 kVp FBP and between 80 kVp FBP and 80 kVp MBIR for reviewer 1 (P = 0.0156). Specificity was 100% in all four settings for both reviewers. Representative images are presented in Figure 4.
Discussion
In our study, we found that ultra-low dose 80 kVp/5 mAs CT was not feasible using the standard FBP algorithm owing to severe image noise, poor image quality, and low diagnostic performance. The AUC (0.883) and sensitivity (61.1%) of 80 kVp images reconstructed with the FBP algorithm provided the lowest values and was not deemed acceptable for one reviewer (reviewer 1). However, with the application of hybrid IR (ASIR) and full IR (MBIR) algorithms, the AUC and sensitivity of 80 kVp CT improved to 0.992~1 and 83.3%~100%, respectively, which was not significantly different from those found at the conventional 120 kVp FBP setting (1 and 100%). Our observation is of practical importance because we demonstrated that 80 kVp CT using IR algorithms may decrease the risk of radiation exposure while maintaining the quality of diagnostic information, especially in young IBD patients subject to repeated CT examinations. Indeed, the mean effective radiation dose of 80 kVp CT was only 0.05 mSv which is significantly lower than that (0.285 mSv) of conventional 120 kVp CT. Thus, with the application of IR algorithms, we can markedly reduce radiation dose by 82.5% while maintaining diagnostic performance. Although the results of this animal study cannot be directly applicable to those of a human study, our results suggest that low kVp CT at 80 kVp and 5 mAs may be feasible with the aid of IR algorithms on CT.
The superior performance of IR algorithms in comparison with FBP reconstruction can be explained by its effectiveness in noise reduction and prevention of artifacts related to the low tube potential. Indeed, we observed a completely opposite trend between image noise and image quality for all four characteristics in both reviewers. The highest image noise was measured at 80 kVp FBP (60.36), followed by 80 kVp ASIR (47.02), 120 kVp FBP (23.48), and 80 kVp MBIR (12.92), in descending order. Accordingly, the lowest image quality score was achieved at 80 kVp FBP (1.29~1.96), followed by 80 kVp ASIR (2.04~2.50), 120 kVp FBP (3.93~4.21), and 80 kVp MBIR (4.71~5). A similar trend was also observed between image noise and diagnostic performance. The lowest sensitivity and AUC was achieved at 80 kVp FBP (61.1% and 83.3%; 0.883 and 0.967, for readers 1 and 2, respectively), followed by 80 kVp ASIR (83.3% and 94.4%; 0.992 and 0.997), 120 kVp FBP (100%; 1), and 80 kVp MBIR (100%; 1). From these observations, we can deduce that the reduction in image noise may directly reflect the improvement in image quality measured by qualitative scoring as well as by sensitivity and AUC.
In addition to the reduction in image noise, the higher attenuation of iodine at 80 kVp than at 120 kVp may also have been responsible for the highest image quality of 80 kVp MBIR. Reducing the tube voltage from 120 to 80 kVp has the advantage of increasing iodine attenuation by a factor of 1.7 as the k-edge of iodine is closer to the reduced tube voltage [4, 5]. This increased attenuation of iodine, in turn, can lead to the increased contrast of vascular structures such as mesenteric vessels and enhanced organs such as the bowel wall and liver. In addition, the increased image contrast obtained at the low kVp setting can be beneficial in evaluating subjects with suspected IBD as changes in the active disease, such as mucosal enhancement and mesenteric hypervascularity, would be readily apparent if the image noise is adequately suppressed [8]. Thus, the high image quality and diagnostic performance observed at the 80 kVp MBIR setting in our study may be due to both increased image contrast as well as more effective noise reduction.
In our study, we used both hybrid, statistic-based IR (ASIR) and full knowledge-based IR (MBIR) algorithms to help compensate for the increased image noise in 80 kVp scanning. Although the hybrid IR technique was also able to significantly reduce the image noise on CT compared with FBP reconstruction, a certain amount of image noise and artifacts remained. Such remnant image noise may have been responsible for the intermediate image quality observed with the 80 kVp ASIR setting. On the other hand, full IR was observed to further decrease image noise, generating virtually noise-free images. Knowledge-based full IR is a new algorithm, which unlike previous IR algorithms, does not involve blending with FBP images, and although it may be mathematically more complex, it is also more accurate [9-11]. The knowledge-based approach accurately determines data, image statistics, and system models, which depict the geometry and physical characteristics of the CT scanner. Owing to its computational complexity, the full IR algorithm requires somewhat longer reconstruction times [9-11], however, with continued rapid improvement in computer hardware, a reduction in reconstruction times can be expected. With the superior results demonstrated with MBIR in this study as well as in previous studies [9-11], removing this limitation of reconstruction time may eventually enable the replacement of ASIR with knowledge-based IR in the near future.
Our study has several limitations. First, while the TNBSA-induced IBD model is advantageous in terms of its high success rate, it does not fully reflect all disease states from acute to chronic in patients with IBD. However, as we had initially planned to establish an acute IBD model, establishing the full disease spectrum was beyond the scope of our current study. In addition, although our purpose was to examine IBD, inflammation is limited to the colon and does not model small bowel involvement. However, since the mechanism of acute inflammation is mediated through the same cascade in different organs, we can expect similar results for small bowel inflammation imaging. Second, an animal study cannot truly represent a human study with different body sizes and body compositions. Considering that radiation dose is highly dependent on body habitus, our study results cannot be directly applicable to human subjects. Third, we only analyzed CT images obtained from a single-vendor CT scanner whose IR algorithms may not be the same as those of other CT scanners available from different vendors. According to a recent article by Löve et al. [12], although most IR algorithms have been shown to improve image quality and reduce image noise, different IR algorithms by different CT vendors have their own strengths and weaknesses. Therefore, our results may not be directly applicable to other IR algorithms of different CT scanners.
In conclusion, ultra-low dose 80 kVp CT is not feasible using the standard FBP algorithm. However, with the application of IR algorithms, the diagnostic performance of 80 kVp CT was acceptable in a rabbit IBD model and on par with that reconstructed with conventional 120 kVp FBP.
 PDF Links
 PubReader
 ePub Link
 Full text via DOI
 Download Citation
 Print
Print